Ah, the question everybody guesses at: is phone insurance worth it? As Mark Watney would say:

Phone insurance generally comes with a monthly premium and a deductable, which we will call \(r\) and \(D\), respectively. If I buy insurance, the expected cost to me is then:
where \(p\) is the probability of losing or damaging the phone at some point in a two year contract period, and n is the number of months I go before losing or damaging the phone. In non-mathspeak, the equation says "The average cost of insurance is the amount you have paid in so far (the rate times the number of months you have made it), plus the average replacement cost (the probability of losing/damaging your phone times the deductable)." Likewise, the expected cost if I don't buy insurance is:
where C is the phone cost. Now, let's throw in some numbers and see what happens. For Verizon with a Samsung Galaxy S7:
- \(r = 7.15\) for the base insurance rate (excluding extended warranty and such)
- \(D = 200\) is the deductible.
- \(C = 670\) is the total phone cost.
Here is an interactive widget to demonstrate the impact that all of the factors have, as a function of the number of months you go before losing/damaging your phone. If the green line is below the blue line for at least half of the range, you should forego insurance!
A More Probabilistic Approach
The analysis above calculates the expected cost under both scenarios, given the probability that you lose or damage the phone at some point in two years. It does a good job of telling you where you start to save money by purchasing insurance, but doesn't really give you any information on just how likely you are to save money. The approach below will do that.
Here, we will redefine \(p\) as the probability of losing/damaging your phone in any given month. From that, we can calculate about how many months you can expect to go before needing a new phone. For the interested parties, this is an application of binomial statistics:
In our case, \(p\) is the probability of losing your phone in any given month, n is still the number of months, and \(k=1\) is the number of times you break/lose your phone (you only need to do it once to need a new one).
Here is what it looks like for a few values of \(p\):
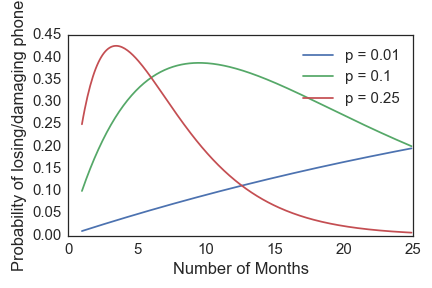
If you have a high probability of losing your phone in any given month, you are most likely to lose it within the first few months (the red curve). Likewise, you can probably last quite a while if you have a low value of \(p\) (the blue curve).
We can go one step further and answer the question "how likely am I to spend more money on insurance than I would on a new phone?". To do that, we need to draw random samples from the probability distributions shown in the figure above. The samples will each represent a different "experiment" and tell me the number of months I went before breaking or losing my phone. My total cost under both scenarios is then:
I split the cost calculation at 24 months because at that point I will be eligible for a new phone, so don't really care if I lose it. The cost difference, assuming a variety of values for \(p\) and the values of \(r, D\), and \(C\) enumerated above for the Verison Galaxy S7, is shown below. Negative cost differences mean you should buy the insurance, while positive differences mean you should not. I give the probability of losing money if you forego the insurance on the top of each panel, and include the value of \(p\) (the probability of losing or damaging your phone in any given month) in the upper right corner.
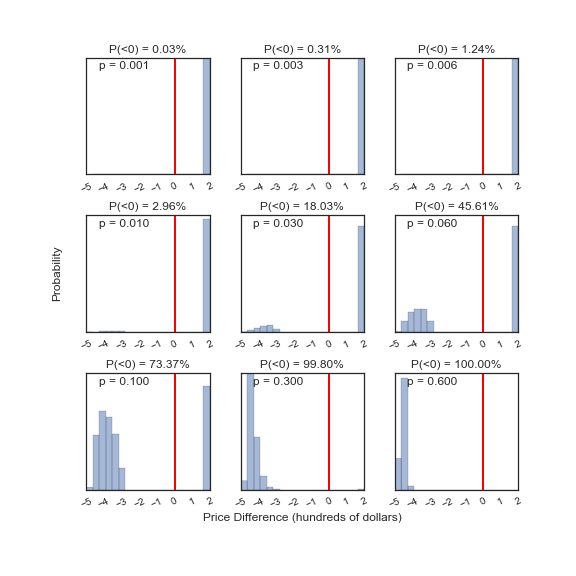
I was not able to find any actual data on how often people lose or damage their phones, but I would say it is pretty low. I have never done it (knock on wood), and only occasionally see people with cracked screens or whatnot. With a protective case and screen cover, the chances of damaging your phone gets really small and so \(p\) is mostly just the chance of theft. What this analysis tells me is that phone insurance is not worth the price unless you are very clumsly/careless so that \(p \gtrsim 0.01\), where the probability of losing money starts climbing rapidly. If your \(p \gtrsim 0.5\), you should probably just not own a phone but definitely get insurance if you do!
Conclusions
I would say \(0.1\) is a reasonable probability of losing my phone at some point in the next two years. That works out to about \(p=0.005\) per month. The first, interactive analysis tells me that I am better off not buying insurance, since the expected cost with insurance is generally larger than without. Likewise, the probabilistic approach gives me a less than \(\sim 1\%\) chance of losing money by skipping insurance. I think I'll take my chances.